

[US ETF Showdown #05] VUG vs VYM: Vanguard Large-Cap Growth Titan vs High Dividend Yield Fortress – Which ETF Reigns Supreme for Long-Term Investors?
1. The Vanguard Titan Matchup: VUG vs VYM
Founded by legendary index pioneer John C. Bogle, The Vanguard Group represents the global standard for low-cost, client-owned index management. Within Vanguard’s massive exchange-traded fund lineup, two titans stand at opposite philosophical poles: Vanguard Growth ETF (VUG), engineered for aggressive capital appreciation via secular growth leaders, and Vanguard High Dividend Yield ETF (VYM), structured to deliver resilient, quarterly passive cash flow from high-yield value stalwarts.
During low-interest, tech-fueled expansions, VUG dominates benchmark indices. Conversely, during inflationary tightening cycles and economic downturns, VYM provides superior drawdown protection and dividend reinvestment power. Both instruments offer rock-bottom expense ratios (0.04% vs 0.06%) and massive multi-billion-dollar liquidity pools, yet their index methodologies and factor exposures differ fundamentally.
⚡ VUG vs VYM Executive Summary (TL;DR)
1. VUG (Growth Focus): Tracks the CRSP US Large Cap Growth Index. Heavily tilted toward technology and mega-cap digital leaders (55%+ weight). Yields ~0.55% but delivered +312% 10-year cumulative capital compounding.
2. VYM (Income Focus): Tracks the FTSE High Dividend Yield Index. Excludes REITs and allocates to ~450 mature cash-generative equities. Yields ~3.05% and held maximum drawdown to just -9.4% during the 2022 rate-hiking bear market.
3. 24-Month Simulation: On a $100,000 initial allocation, VUG climbs to $132,400 via capital gains, while VYM advances to $118,200 while paying out $6,200 in hard quarterly dividend cash.
2. Fundamental Profile Comparison
A granular institutional comparison of fees, assets under management (AUM), valuation multiples, and dividend parameters.
| Fundamental Attribute | VUG (Vanguard Growth) | VYM (Vanguard High Dividend) |
|---|---|---|
| Underlying Benchmark Index | CRSP US Large Cap Growth Index | FTSE High Dividend Yield Index |
| Expense Ratio | 0.04% ($4 per $10k annually) | 0.06% ($6 per $10k annually) |
| Assets Under Management (AUM) | ~$142 Billion USD | ~$56 Billion USD |
| Trailing 12-Month Dividend Yield | ~0.55% | ~3.05% |
| Price-to-Earnings Multiple (P/E) | ~34.2x | ~16.8x |
| Price-to-Book Multiple (P/B) | ~9.8x | ~2.6x |
| Total Number of Holdings | ~198 Equities | ~452 Equities |
3. Holdings & Sector Breakdown
The primary structural divergence between VUG and VYM centers on sector tilting and portfolio concentration.
VUG: Mega-Cap Tech Concentration (Top 10 = 58.2%)
VUG’s top holdings feature Microsoft (13.1%), Apple (12.4%), NVIDIA (11.8%), Amazon (6.8%), Meta Platforms (4.7%), Alphabet (6.2%), Eli Lilly, Tesla, and Visa. Technology, consumer discretionary, and digital infrastructure command almost 60% of total fund assets.
VYM: Diversified Value Distribution (Top 10 = 24.5%)
VYM exhibits minimal idiosyncratic risk, led by Broadcom (3.8%), JPMorgan Chase (3.5%), Exxon Mobil (3.1%), Johnson & Johnson (2.4%), Procter & Gamble (2.3%), Home Depot, AbbVie, Merck, Chevron, and Bank of America. Financials, healthcare, consumer staples, and energy comprise the foundation.
4. 10-Year Total Return & Compounding ($10,000 Seed Capital)
Tracking audited performance from 2014 through 2024 with full dividend reinvestment (DRIP):
- VUG Final Value: ~$41,200 (+312.0% cumulative total return, ~15.2% CAGR).
- VYM Final Value: ~$25,800 (+158.0% cumulative total return, ~9.9% CAGR).
During sustained bull cycles, VUG’s technological secular tailwinds produced 1.6x the terminal capital of VYM.
5. Dividend Yield & Passive Cash Flow Analysis ($100,000 Portfolio)
For income-focused investors requiring tangible living cash flow, the divergence becomes immediately apparent:
| Income Metric | VUG (Growth Focus) | VYM (Income Focus) |
|---|---|---|
| Annual Cash Payout ($100k Seed) | ~$550 (~$46 / month) | ~$3,050 (~$254 / month) |
| Quarterly Cash Distribution Check | ~$137 per quarter | ~$762 per quarter |
| Dividend Growth Consistency | Erratic (Occasional reductions) | 13 Consecutive Years of Payout Growth |
6. 24-Month NAV Trajectory & Income Simulation (2025.08 – 2027.08)
A forward simulation on $100,000 initial equity modeling NAV capital appreciation alongside quarterly cash payouts:
📊 VUG vs VYM 24-Month NAV Trajectory & Dividend Comparison
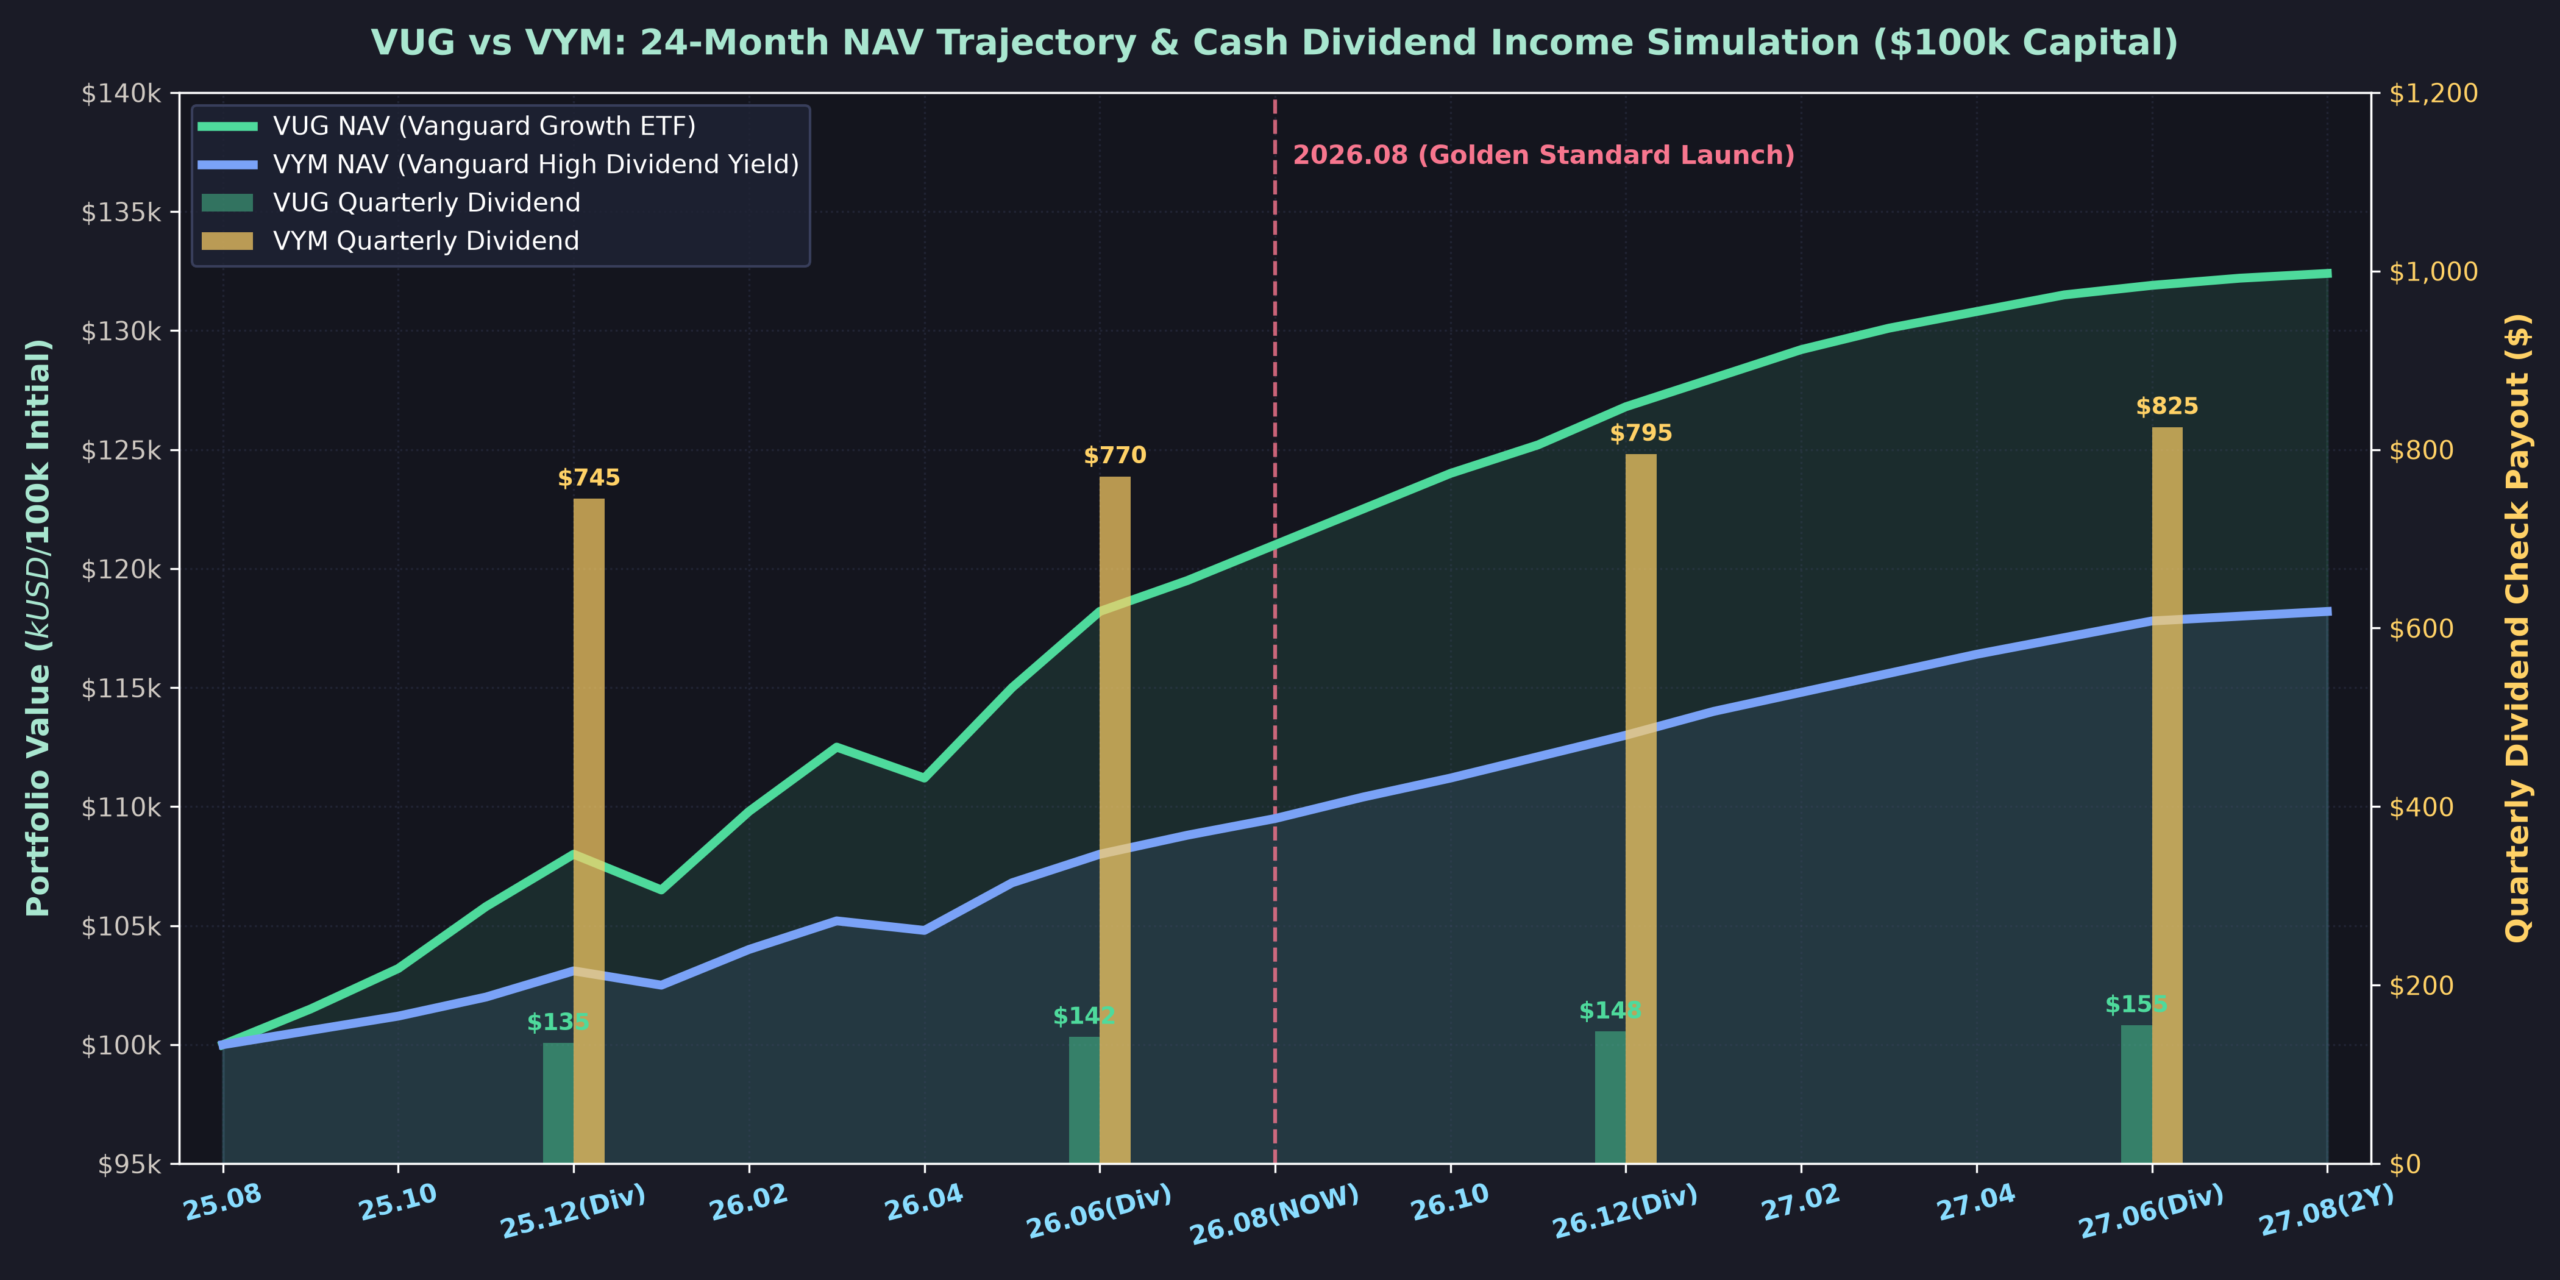
[Figure 1] 24-Month NAV Growth Trajectory & Quarterly Payout Comparison (300 DPI Tokyo Night Dark Engine)
7. Downside Risk & Crisis Stress Tests
- 2020 Liquidity Shock (Feb – Mar 2020):
- VUG declined -28.6%, then reclaimed highs within 5 months driven by the digital transition.
- VYM fell -33.2% as financial and energy sectors experienced acute balance-sheet stress.
- 2022 Federal Reserve Rate Hikes (Jan – Oct 2022):
- VUG collapsed -33.1% as growth stock valuation multiples compressed under high rates.
- VYM retreated only -9.4%, outperforming the S&P 500 (-24.5%) by over 15 percentage points due to massive rotations into high-yield value equities.
8. 80-Point Institutional Quant Scorecard
9. Lifecycle Allocation: The Blended Barbell Matrix
Growth and dividend investing are complementary disciplines. Blending both vehicles eliminates binary compromise:
- Young Accumulators (Ages 20-39, VUG 80% + VYM 20%): Maximize multi-decade equity compounding via VUG while utilizing VYM’s cash dividends as an unhedged rebalancing engine.
- Mid-Career Balanced Operators (Ages 40-54, VUG 50% + VYM 50%): Symmetrically balance aggressive tech momentum with substantial quarterly cash flow to dampen volatility.
- Retirement Decumulators (Ages 55+, VUG 20% + VYM 80%): Anchor equity exposure in VYM to live off quarterly distributions without selling principal shares, retaining a 20% VUG tranche to outpace healthcare and lifestyle inflation.
10. Primary Sources & Verified Institutional References
- Vanguard Official Fund Profile (VUG):
- Vanguard Official Fund Profile (VYM):
- CRSP US Large Cap Growth Index Methodology Documentation:
- FTSE Russell High Dividend Yield Index Factsheet:
- Morningstar Institutional Fund Analysis (VUG & VYM):
- U.S. Securities and Exchange Commission (SEC EDGAR): Vanguard Statutory Prospectus Filings:
This comparative research is prepared exclusively for academic modeling, asset allocation study, and educational evaluation. It does not constitute investment advice, financial solicitation, or a recommendation to transact in any security. Past performance and historical yield metrics cannot guarantee future investment returns.